Direct Answer: Climate risk is not abstract for property restoration and remediation contractors. It is the force multiplier behind every catastrophic event deployment, every insurance claim cycle, every labor constraint, and every pricing negotiation in 2026. While C-suite executives at insurance companies and healthcare systems.
.md twin for Storm, Flood & CAT Response.
Updated October 6, 2026.
Climate risk is not abstract for property restoration and remediation contractors. It is the force multiplier behind every catastrophic event deployment, every insurance claim cycle, every labor constraint, and every pricing negotiation in 2026. While C-suite executives at insurance companies and healthcare systems write climate risk disclosures and build scenario models, restoration companies are living the physical reality every day: higher frequency of major events, higher intensity of damage, longer claim processing windows, tighter insurance capacity, and accelerating demand for restoration services.
The numbers are stark. Swiss Re reported that natural catastrophes caused economic losses exceeding $280 billion in 2024, with climate change amplifying both frequency and severity. In the U.S., catastrophic events are driving property insurance market hardening-carriers are narrowing coverage, raising premiums, and exiting high-risk zones entirely. This market disruption is reshaping how restoration contractors price services, manage labor and equipment capacity, negotiate with insurance companies, and plan capital investment.
2026 Climate-Risk Restoration Operations & Strategy Toolkit
Field deployment constraints, 60–90+ day claim squeeze logs, labor burst calculators, 3-strategy pricing sheets, and executable AI claim routines built directly from this analysis.
The Climate-Risk Ops Quick Card
2-page field card: Demand vs. capacity amplifier metrics, 30–45 vs. 60–90+ day claim-flow squeeze gates, and the three 2026 pricing postures at headline level.
Direct download • No email gate
2026 Climate-Risk Ops Pack
Printable/fillable 8-page working pack: CAT Deployment Constraint Checklist, Claim Flow Squeeze Log, Labor Burst Capacity Worksheet, Pricing Strategy Comparison Sheet, and Supply Chain Resilience Template.
Instant checkout • Square verified
Climate-Risk Restoration Strategist
Feed directly to ChatGPT, Claude, Gemini, or local LLMs: 5 executable AI routines for CAT surge capacity, claim cash diagnostics, pricing strategy selection, supply disruption resilience, and liability stress-testing + router.
Software made of words • Instant delivery
The Demand Amplifier: Why Restoration Services Are Growing Faster Than Capacity
Restoration contractors face a structural demand shift. Climate-driven hazards-severe flooding, wildfire damage, hail storms, hurricane wind and water damage-are creating higher frequency and higher severity loss events across North America. Data from industry sources show 15-20% annual growth in restoration demand in climate-exposed geographies (coastal zones, wildland-urban interface regions, flood-prone areas).
This growth appears beneficial on the surface-higher demand should mean higher revenue. In practice, it is creating operational strain. Catastrophic events are inherently geographic-a major hurricane, flood, or wildfire affects hundreds or thousands of properties simultaneously in the same region. Restoration contractors in affected areas face explosive demand spikes followed by periods of underutilization. Managing this boom-and-bust cycle is harder than steady-state growth.
During a major event, contractors face cascading constraints: labor availability (crews are working 12-14-hour days, local workforce is finite, bringing in crews from outside the region adds cost), equipment availability (water extraction equipment, drying units, generators are rented from a limited regional pool and prices spike during CAT events), material availability (gypsum board, insulation, roofing materials become scarce and expensive when large areas are damaged simultaneously), and permitting delays (local building departments are overwhelmed with inspections and permit applications).
Insurance Market Hardening: The Claim Flow Squeeze
The insurance market’s response to climate risk is reshaping the entire claims and restoration pipeline. Major carriers are reducing capacity in high-risk zones, exiting certain markets entirely, raising premiums substantially, and implementing stricter underwriting standards. Secondary and excess carriers are following the same path, creating a capacity gap in the middle market.
For restoration contractors, this manifests as delayed claim processing, stricter claim adjudication, and lower settlement values for some claim categories. Insurance adjusters in 2026 are working through larger backlogs, taking longer to inspect properties, and more frequently asking for second opinions or contested repairs. This slows the claims cycle-the time from loss event to claim payment-and forces restoration contractors to finance more work-in-progress inventory while awaiting insurance payment.
Some contractors report claim approval timelines extending from 30-45 days (pre-2020 norm) to 60-90+ days. Longer claim cycles mean contractors need larger working capital reserves, more credit line capacity, or higher payment terms from suppliers. For smaller restoration companies without robust credit access, this creates financial stress.
The pricing dynamic is also shifting. Where contractors once negotiated price with adjusters based on standard repair rates, they now face tighter scrutiny on scope, methodologies, and material specifications. Some adjusters are pushing for “cash settlement” (pay the policyholder a lump sum and let them hire contractors) rather than directing repair, reducing contractor negotiating power. Other adjusters are requiring competitive bids, eroding margin.
Labor and Capacity Planning in a Climate-Stressed Market
Restoration contractors in 2026 are struggling to balance base operations with burst capacity needs. A regional restoration company typically operates 30-50 crews year-round handling routine water damage, mold remediation, fire loss, and other non-catastrophic work. When a major hurricane or flood event hits, demand can spike 200-300%, requiring contractors to rapidly hire temporary crews, negotiate equipment rentals at peak pricing, and extend operations into extended hours.
However, labor availability is constrained. Skilled restoration technicians are trained to specific certifications (IICRC water restoration, fire restoration, mold remediation), and the supply of trained labor is not scaling fast enough to meet demand. Contractors report difficulty finding qualified crews during CAT events, leading to reliance on less-experienced contractors or subcontractors, which introduces quality risk and potential liability exposure.
Wage inflation is accelerating. Base crew wages have increased 15-25% over the past 3 years as contractors compete for talent. During CAT events, contractors pay premium wages (time-and-a-half or more) to attract crews from surrounding areas. This squeezes margins on CAT work unless contractors can offset higher labor costs with higher pricing to insurance companies-which is becoming harder as insurance companies narrow settlements.
Many contractors are investing in equipment to increase labor productivity (high-capacity water extraction, advanced drying systems, thermal imaging), but equipment capital cost is significant and requires higher utilization to achieve ROI. Equipment financing cost adds to operational overhead, making it critical to achieve consistent utilization across year-round and CAT operations.
Pricing Strategy Under Climate Uncertainty
Restoration contractors are fundamentally rethinking pricing strategy. Traditional models assumed relatively stable claim frequency and severity from year to year. Climate-driven changes have invalidated that assumption. Contractors now face choices:
Opportunistic CAT Pricing: Increase rates during CAT events when demand far exceeds local capacity. This maximizes short-term revenue during peak demand, but can damage relationships with insurance companies and is ethically fraught-raising prices when customers are in crisis.
Risk-Adjusted Base Pricing: Incorporate expected future climate risk into year-round pricing. If a contractor expects increasing frequency of major events, higher labor costs, and tighter insurance negotiations, they can raise base rates to fund capacity investments and build reserves for periods of underutilization between events. This spreads cost across all customers and is more sustainable long-term.
Capacity-Constrained Pricing: Recognize that existing equipment and labor capacity is limited and charge higher rates to manage demand to sustainable levels. This is price signaling-high rates during periods of high demand naturally reduce volume, preventing overcommitment. It also maximizes margin per job when demand is strongest.
Leading restoration contractors are moving toward risk-adjusted base pricing combined with capacity-constrained pricing. This approach funds continuous investment in capacity, does not exploit customers in crisis, and creates more predictable margins across economic cycles.
Protect Operating Margins & Audit Claim Cash Flow Cycles
As insurance carriers narrow coverage and claim processing cycles lengthen from 30–45 days to 60–90+ days, restoration contractors must finance substantially larger work-in-progress while absorbing 15–25% labor wage inflation and 25–40% insurance premium hikes. Opportunistic CAT pricing damages insurer relationships and risks regulatory scrutiny; risk-adjusted base pricing and capacity-constrained pricing fund sustainable fleet expansion without crisis exploitation. Equip your operations with printable constraint checklists, surge capacity worksheets, and interactive AI diagnostic playbooks built directly from this strategy guide.
What’s In The Strategy Pack:
• Claim Squeeze Log: 30–45 vs 60–90+ day WIP cash tracker.
• Labor Burst Sheet: Base-to-spike crew multiples & cert gaps.
• Pricing Matrix: Opportunistic vs risk-adjusted vs capacity-constrained.
• Supply Resilience: Drywall, insulation & roofing reservation plan.
• Bot Book ($17): 5 executable AI routines + autonomous router.
Supply Chain Resilience and Vendor Relationships
Restoration work requires consistent supply of materials-drywall, insulation, flooring, roofing, paint, hardware, appliances, and dozens of other components. Climate disruption is affecting material supply in two ways: direct disruption (manufacturing facilities or distribution centers affected by flooding, fire, or other CAT events) and indirect disruption (demand spikes during major events exhaust local inventory).
Contractors report difficulty sourcing materials during large-scale CAT events. A major hurricane affecting Louisiana might damage gypsum plants or distribution centers, constraining supply across multiple states for weeks. A wildfire affecting California construction material distribution might raise prices and extend delivery timelines. During these windows, contractors face choices: delay jobs (losing customer satisfaction and insurance adjuster relationships), pay premium prices for expedited delivery, or substitute materials (changing job specifications mid-project).
Smart contractors are building vendor relationships that include CAT event supply contingencies. Some are negotiating inventory reservation agreements with material suppliers-paying for committed inventory that remains available during high-demand periods. Others are diversifying suppliers geographically to avoid concentration risk. A few are investing in material inventory (carrying costs are high, but inventory availability during CAT events is a competitive advantage).
Insurance and Liability Coverage Under Climate Risk
Restoration contractors carry multiple insurance products: general liability (covers bodily injury and property damage to third parties), professional liability (covers errors and omissions in restoration work), workers compensation (required in all states), and commercial auto insurance (for fleet vehicles). Climate change is affecting all of these lines.
General liability and professional liability carriers are increasing premiums and reducing capacity in high-risk geographies. Some carriers are exiting the restoration segment entirely, reducing competition and pushing rates higher. Contractors in coastal zones or wildfire-adjacent regions report 25-40% increases in liability insurance cost over 2-3 years. This cost is built into project pricing but also reduces net margin if customers are price-sensitive.
Workers compensation insurers are becoming more stringent about workplace safety and hazard reporting, particularly for crews working in contaminated water (flood damage) or heat-stressed environments (wildfire-adjacent regions). Contractors must invest in safety training, PPE (personal protective equipment), and incident documentation to maintain reasonable rates and coverage. Non-compliance can result in coverage denial or policy cancellation.
Building Climate Resilience Into Restoration Operations
The contractors best positioned for 2026 and beyond are those building climate resilience into operations. This includes:
Capacity Investment Aligned with Climate Scenarios: Investing in equipment, facilities, and personnel with understanding that future demand will likely be higher and more volatile than historical baselines. This might mean larger equipment fleet, regional staging facilities, or permanent staff sufficient to handle baseline demand plus 50% surge capacity.
Vendor Diversification and Supply Chain Mapping: Understanding which suppliers are critical, which are concentrated in climate-vulnerable regions, and which can be substituted or sourced from multiple vendors. Building relationships with vendors outside primary climate risk zones as backup sources.
Data-Driven CAT Forecasting: Using climate hazard mapping and historical loss data to anticipate where and when CAT events are likely to occur, allowing contractors to pre-position equipment and crews in advance of major events rather than scrambling reactively.
Workforce Development and Retention: Investing in training programs, competitive wages, career pathways, and workplace safety to reduce turnover and build a skilled labor base that can scale with demand. Contractors who treat labor as a commodity will struggle; those who build culture and invest in people will retain institutional knowledge and capacity.
Financial Planning for Longer Claim Cycles: Ensuring adequate working capital, credit lines, and financial reserves to fund work-in-progress for 60-90 day claim cycles. This might mean lines of credit, project financing, or factoring arrangements that provide cash flow while awaiting insurance payment.
Regulatory and Disclosure Risk
As organizations across sectors-insurers, healthcare systems, corporations-implement climate risk disclosure under ISSB, TNFD, California SB 2331, SB 253, and other frameworks, restoration contractors are beginning to appear in those disclosures. A healthcare system disclosing physical climate risk must identify which facilities face flood risk, how that affects emergency preparedness, and what remediation or insurance arrangements are in place. That disclosure naming a restoration contractor as a key vendor/partner introduces reputational and regulatory exposure if that contractor is undercapacity or unreliable.
This creates indirect regulatory pressure on restoration contractors to demonstrate operational resilience, financial stability, and climate preparedness. Leading contractors should begin documenting capacity, financial health, and climate risk mitigation plans for the benefit of insurance company and corporate customers who are undergoing climate risk disclosure.
For broader context on climate risk and cross-sector implications, see Physical and Financial Climate Risk in 2026: The Cross-Sector ESG Disclosure Framework Every Organization Needs. For property damage and insurance-specific topics, refer to Climate-Driven Restoration Demand and Property Insurance Claims for Restoration. For insight into how insurance companies are repricing risk, read Climate Risk and Insurance Pricing in 2026: How Physical Hazards Are Repricing Every Line of Coverage.
Conclusion
Physical climate risk is no longer a peripheral concern for restoration contractors-it is the central force reshaping demand, capacity, labor, supply chains, and profitability. Contractors treating climate risk as a temporary volatility problem are at disadvantage. Those building permanent capacity expansion, vendor diversification, workforce stability, and financial resilience into strategy are positioning themselves for sustainable growth in a climate-stressed market. The competitive advantage in restoration goes to operators who can reliably scale to meet surging demand, maintain quality under pressure, and navigate tightening insurance relationships while building profitable, sustainable businesses.
Climate-Risk Restoration Strategy Resource Ladder
Choose the level of field documentation, working operational templates, and AI-powered business diagnostics needed for your restoration firm.
The Climate-Risk Ops Quick Card
2-page field stop-and-check card: The demand outrunning capacity squeeze, 30–45 vs 60–90+ day claim-flow gates, and the three pricing postures at headline level.
• Capacity Spikes: 200–300% CAT demand surge and mobilization limits
• Claim Squeeze: 30–45 to 60–90+ day lengthening and WIP capital drag
• Labor & Cost Pressures: 15–25% 3-year wage inflation & premium jumps
• Three Pricing Postures: Opportunistic vs risk-adjusted vs capacity-constrained
2026 Climate-Risk Ops Pack
Printable/fillable 8-page working pack: complete field constraint checklists, claim squeeze logs, labor burst calculators, and supplier resilience sheets.
• Sheet 2: Claim Flow Squeeze & Cash Acceleration Log (WIP Financing Tracker)
• Sheet 3: Labor Burst Capacity & Wage Inflation Worksheet (Base-to-Spike Math)
• Sheet 4: Pricing Strategy Comparison Sheet (Opportunistic vs Risk-Adjusted)
• Sheet 5: Supply Chain Resilience & Reservation Agreement Template
• Sheet 6: Capital Expenditure & Equipment Pool Allocation Planner
• Sheet 7: Executive Climate-Risk Operations Readiness Scorecard
Climate-Risk Restoration Strategist
Structured text document feeding 5 executable AI routines directly to ChatGPT, Claude, Gemini, or local LLMs to audit burst capacity, cash flow cycles, and pricing posture.
[ROUTINE-1]: CAT Burst Capacity & Surge Labor Audit•
[ROUTINE-2]: Claim Cycle Cash Diagnostic & WIP Financing Planner•
[ROUTINE-3]: Pricing Strategy Selector & Margin Stress-Test•
[ROUTINE-4]: Supply Chain Disruption Resilience Builder•
[ROUTINE-5]: Comprehensive Liability Coverage Stress-Test•
[ROUTER]: Embedded Autonomous Command & Dispatch Router
Related: Climate-driven restoration demand · Sustainable restoration practices · Social inflation and restoration litigation.
Updated Nov 2, 2026 — added the free climate-risk ops quick card, climate-risk restoration ops pack, and climate-risk restoration strategist downloads to this analysis.
How Physical Climate Risk Is Rewriting Restoration Business Strategy in — Visual Workflow
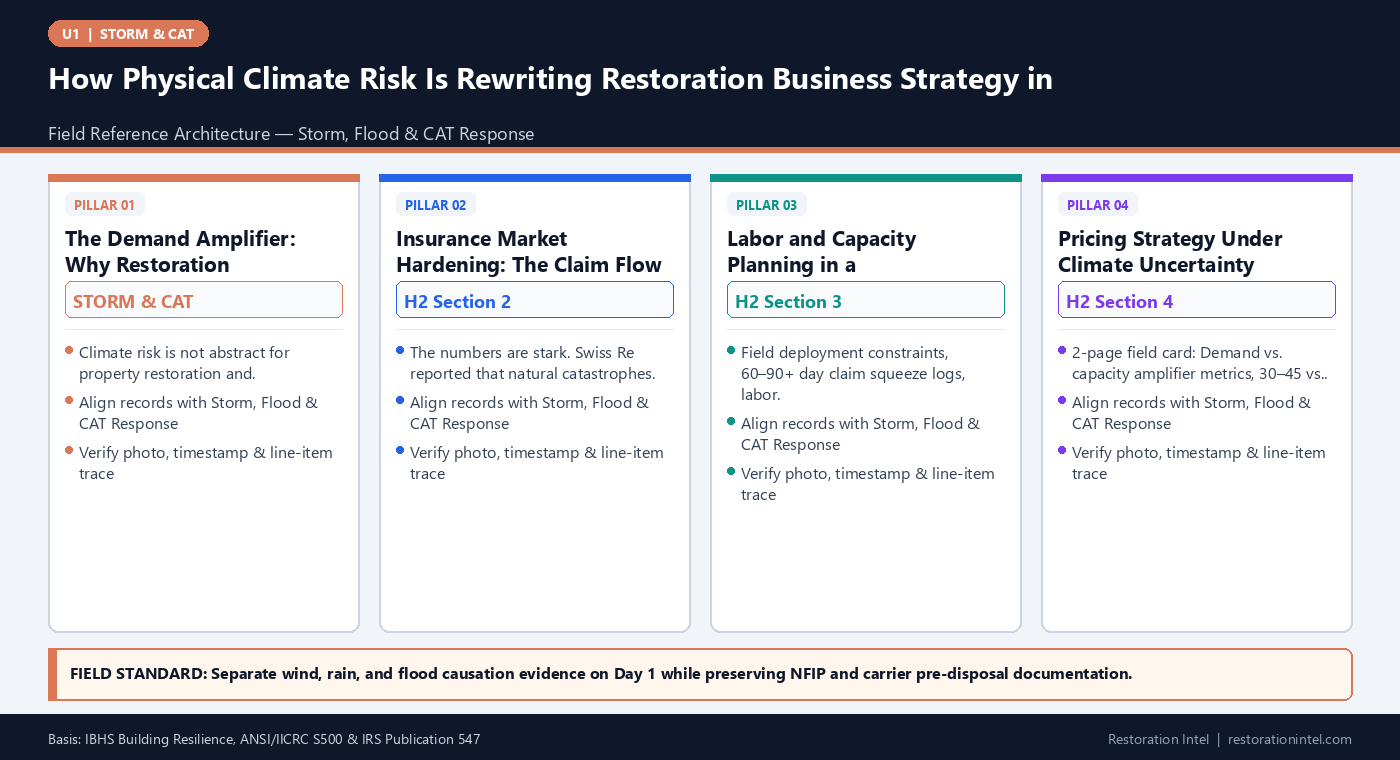
Field Operational Breakdown & Verification Matrix
Structured operational summary of How Physical Climate Risk Is Rewriting Restoration Business Strategy in 2026 mapped to Restoration Intel documentation gates.
| Operational Stage | Field Focus in This Guide | Documentation Requirement | Verification Gate |
|---|---|---|---|
| 1. The Demand Amplifier: Why Restoration | Climate risk is not abstract for property restoration and remediation contractors.. | Timestamped photos, measurements & scope notes | Cross-check against primary standard prior to submission |
| 2. Insurance Market Hardening: The Claim | The numbers are stark. Swiss Re reported that natural catastrophes caused economic. | Timestamped photos, measurements & scope notes | Cross-check against primary standard prior to submission |
| 3. Labor and Capacity Planning in a | Field deployment constraints, 60–90+ day claim squeeze logs, labor burst. | Timestamped photos, measurements & scope notes | Cross-check against primary standard prior to submission |
| 4. Pricing Strategy Under Climate Uncertainty | 2-page field card: Demand vs. capacity amplifier metrics, 30–45 vs. 60–90+ day. | Timestamped photos, measurements & scope notes | Cross-check against primary standard prior to submission |
Standards, Authority Citations & Related Guides
- Insurance Institute for Business & Home Safety (IBHS)
- ANSI/IICRC S500 Water Damage Standard
- IRS Publication 547: Casualties, Disasters, and Thefts
- Related Guide: Before Anything Goes: The NFIP Contents Inventory
- Related Guide: Salvage Is a Window, Not a Service
- Related Guide: Reconstruction Materials Matching & Like-Kind Quality Standards
.md twin for carrier and field review.Frequently Asked Questions
What is the core operational takeaway of How Physical Climate Risk Is Rewriting Restoration Business Strategy in 2026?
Climate risk is not abstract for property restoration and remediation contractors. It is the force multiplier behind every catastrophic event deployment, every insurance claim cycle, every labor constraint, and every pricing negotiation in 2026. While C-suite executives at insurance companies and healthcare systems.
Which industry standards govern storm, flood & cat response documentation?
Practitioners should anchor field logs and claim packets to Insurance Institute for Business & Home Safety (IBHS) and ANSI/IICRC S500 Water Damage Standard, ensuring verifiable measurements and photo provenance.
Where can field and estimating teams access the offline or AI-readable edition?
Each upgraded Restoration Intel guide ships with a 2-page Print-First PDF brief and a plain-text Markdown twin (.md) linked directly inside the article download cards and /llms.txt.