Published November 14, 2026. By Will Tygart · Restoration Intel Editorial Desk.
Direct answer. Restoration teams should measure contents inventory accuracy across five separate dimensions — item count recall, category precision, brand/model match rate, quantity accuracy, and Like-Kind-and-Quality (LKQ) pricing variance — rather than relying on a single blended percentage that hides downstream estimating rework and carrier disputes.

Ask two restoration project managers what an accurate contents inventory looks like and you will hear two incompatible definitions. A crew lead usually means nothing in the truck got lost between the house and the vault. A contents estimator means every line in XactContents or Symbility carries a defensible room location, age/condition note, category code, and supportable replacement source.
Conflating physical custody with line-item schedule accuracy is the root cause of most post-submission supplements. Even a crew that packs 100 percent of visible household items can produce an inventory schedule with a 25 percent dollar variance if high-value appliances lack model numbers or dense closets are collapsed into vague box lots. Defining accuracy as five distinct, auditable dimensions gives contents divisions a shared scorecard aligned with ANSI/IICRC S320 documentation rigor and carrier desk review expectations.
The Five Contents Inventory Accuracy Dimensions & Audit Formulas
Each metric isolates a specific failure mode between field capture, estimating desk enrichment, and adjuster review.
| Dimension | Public Audit Formula | Operational Field Failure | Downstream Carrier Impact | QA Owner |
|---|---|---|---|---|
| 1. Item Count Recall | Matched Ground-Truth Items / Total Auditable Items | Closed cabinets, dark garage shelves, or hurried pack-out box sweeps missed | Omitted items force insured pushback and unbilled field return trips | Field Crew Lead |
| 2. Category Precision | Correctly Classified Lines / Total Matched Lines | Grouping specialty cookware, power tools, or electronics into generic miscellaneous lots | Applies wrong depreciation lifespan or triggers carrier bulk-line disallowance | Contents Estimator |
| 3. Brand & Model Match | Verified OEM Spec Lines / High-Value Tagged Assets | Obscured rating plates, glare over labels, or omitted sub-model suffixes | Adjuster substitutes entry-level retail comp instead of prosumer LKQ | Field + QA Desk |
| 4. Quantity Accuracy | 1 – (|Logged Qty – True Qty| / True Qty) per Multi-Unit Lot | Eyeballing pantry rows, fastener bins, or dense hanger racks instead of counted sub-lots | Understated volume shrinks RCV; overstated guesses invite credibility audits | Field Technician |
| 5. LKQ Pricing Variance | (Submitted Line RCV – Carrier Verified LKQ RCV) / Verified RCV | Stale regional price lists, shipping omissions, or third-party marketplace phantom SKUs | Desk examiner hair-cuts replacement line pricing without changing physical scope | Contents Estimator |
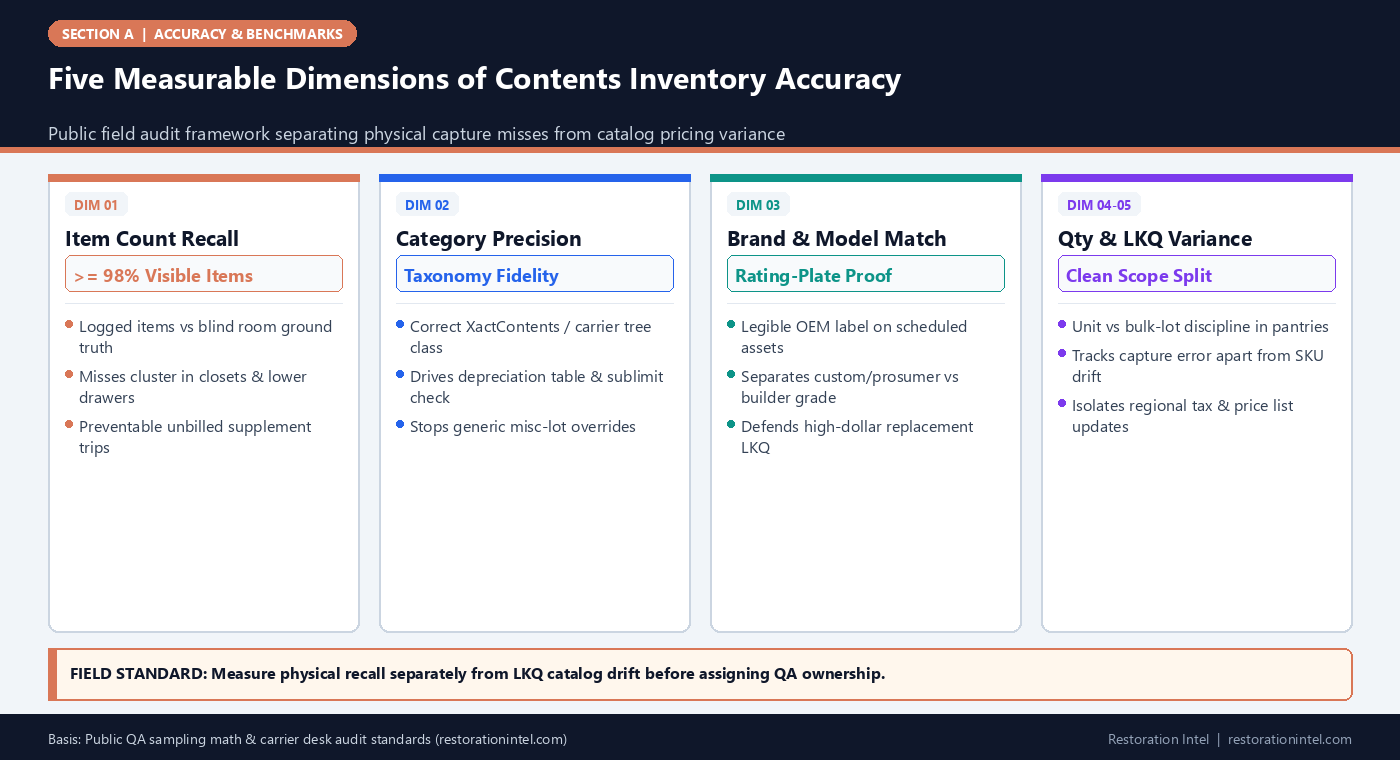
Why Single Accuracy Scores Hide Costly Failure Modes
A composite accuracy number looks tidy on an operations dashboard until you inspect what it averages out. Imagine a 400-line residential fire inventory where field crews miss four commercial-grade espresso/kitchen machines worth $4,200 combined while correctly logging 396 everyday utensils, linens, and paperback books. On raw count recall, the job scores 99.0 percent. On insured trust and claim margin, the job just lost $4,200 in uncaptured scope or forced an expensive supplementary inspection.
Conversely, an inventory can capture 100 percent of physical objects yet still stall at desk review if estimators leave brand, material, or age fields blank on 30 percent of furniture and appliance lines. Separating physical recall (did we record it exists?), classification precision (did we name what policy class it belongs to?), and valuation accuracy (did we attach a fair LKQ comp?) keeps estimators from blaming technicians for catalog issues and stops managers from blaming pricing tools for closed drawers.
- Audit separation principle: Grade physical capture completeness before a single replacement SKU price is looked up.
- Weighted value check: Always inspect dollar-weighted recall alongside count-weighted recall because top-decile items drive over half of residential claim value.
- Zero-blend reporting: Never average item count recall with LKQ pricing delta inside weekly QA scorecards.
Setting Realistic Tolerance Bands by Asset Tier
Uniform perfection targets waste crew hours where carriers do not ask for SKU-level forensics. Spending four minutes photographing individual wooden spoons to raise recall from 97 percent to 100 percent on $2 kitchenware yields negative margin, whereas accepting 90 percent serial capture on appliances, electronics, or specialty tools guarantees supplement friction.
High-performing contents divisions run tiered accuracy bands tied to replacement unit value and policy sublimit sensitivity. As emphasized in A Pack-Out Record Is Not a Priced Inventory, the job site team’s priority is capturing unmistakable identity and condition evidence for items whose replacement or restoration decision hinges on proof.
- Tier 1 (High-value > $500 / sublimit items): Target 100 percent item recall, legible brand/model proof, and timestamped pre-cleaning condition photos.
- Tier 2 (Mid-tier $75–$500 household goods): Target ≥ 98 percent item recall, verified category tree placement, and representative material/quality tags.
- Tier 3 (Consumables, pantry stock, & dense smalls < $75): Apply transparent lot-counting rules with photo context of shelf density and explicit exclusion of opened perishables when policy requires.
Operationalizing the Five Metrics Across Pack-Out and Total-Loss Workflows
Measurement only changes field behavior when each metric maps to a gate before delivery. Before a schedule leaves the estimating desk, QA should run two distinct passes: a capture completeness check verifying every room boundary, closet, and vault box matches the photo index, followed by a catalog and depreciation check auditing category codes and LKQ comps.
For total-loss rooms where physical pack-out never happens, photo-to-line traceability replaces box barcodes as the custody spine. Documenting which metrics passed at each handoff creates an objective feedback loop between field training and carrier acceptance — the exact foundation needed before benchmarking manual, barcode, or AI-assisted capture pipelines.
Field Execution Checklist
- Log physical Item Count Recall separately from Category Precision and LKQ Pricing Variance on every internal audit sheet.
- Verify 100 percent brand, model, and condition photo coverage on every non-salvageable or Tier 1 item (>$500 RCV) prior to disposal.
- Require explicit room-to-box mapping so warehouse receiving counts reconcile cleanly against initial site walkthrough schedules.
- Track carrier desk revision requests by root-cause dimension (missed item, wrong category, missing spec, or price comp dispute).
- Maintain clear separation between insured property schedules and mitigation drying equipment billing per S320/S500 scope hygiene.
Related Restoration Intel Guides & Reference Standards
- Companion Brief (A-02): Item Count Recall vs Category Precision: Why Most Field Audits Measure the Wrong Metric
- Companion Brief (A-03): Designing a Blind Room Audit to Test Any Contents Inventory Workflow
- Companion Brief (A-06): Pricing Variance in Contents Schedules: Separating Capture Errors from Catalog Drift
- Internal Guide: A Pack-Out Record Is Not a Priced Inventory
- Internal Guide: A Price Tag on a Lost Item Is Worth Nothing
- Primary Authority: ANSI/IICRC S320 Standard for Professional Contents Restoration
- Primary Authority: Verisk XactContents Platform Overview
- Primary Authority: Restoration Industry Association (RIA)
- Primary Authority: NIST AI Risk Management Framework
Frequently Asked Questions
What is a realistic target for item count recall on a residential pack-out?
For Tier 1 high-value items and primary furnishings, teams should enforce 100 percent recall. Across entire cluttered homes including closets and basements, 96 to 98 percent unit/lot recall against a blind spot-audit is a practical operational benchmark.
Why separate pricing variance from field capture accuracy?
Because pricing variance can happen even when technicians photographed the exact item and model plate cleanly. Splitting catalog/price-list drift from field capture mistakes prevents teams from retraining field crews on estimating desk problems.
Do insurance adjusters require brand and model numbers on low-value items?
Usually no. Carriers focus brand/model scrutiny on electronics, major appliances, power tools, musical instruments, and scheduled or sublimited categories, while mid-to-low household goods require accurate object type, quantity, quality tier, and condition.
How does ANSI/IICRC S320 intersect with inventory accuracy?
S320 establishes professional contents restoration process expectations around inventory tracking, condition documentation, pack-out custody, and justifiable restore-vs-replace triage, all of which rely on accurate line-level identification and photo linkage.
.md twin (how-restoration-teams-measure-contents-inventory-accuracy.md).