Direct Answer: Contents Estimator performance should be tracked across first-pass adjuster acceptance rate, capture-to-submission cycle time, estimating rework hours caused by upstream capture defects, LKQ dispute rate, and gross-margin realization rather than raw line-item volume alone.
.md twin for estimator QA and carrier file documentation.
Measuring a Contents Estimator and Claim Packet Specialist solely by ‘lines priced per day’ creates perverse incentives. An estimator pressured to maximize raw row counts can hit daily quotas by leaving model numbers blank, ignoring duplicate checks, or copying weak retail prices—only to generate weeks of carrier revisions, unpaid supplement chasing, and eroded division margin.
High-performing contents divisions measure estimator effectiveness across the full claim cash-conversion cycle inside Verisk Claims, Xactimate, and XactContents workflows. The right scorecard links speed, first-pass carrier acceptance, pricing defensibility, and internal estimating labor cost per submitted claim.
Tracking these metrics cleanly also exposes upstream operational bottlenecks. When desk rework hours spike on specific field crews or loss types, leadership can target field capture training where it actually protects margin—turning the estimating desk into an objective quality engine for the entire restoration business.
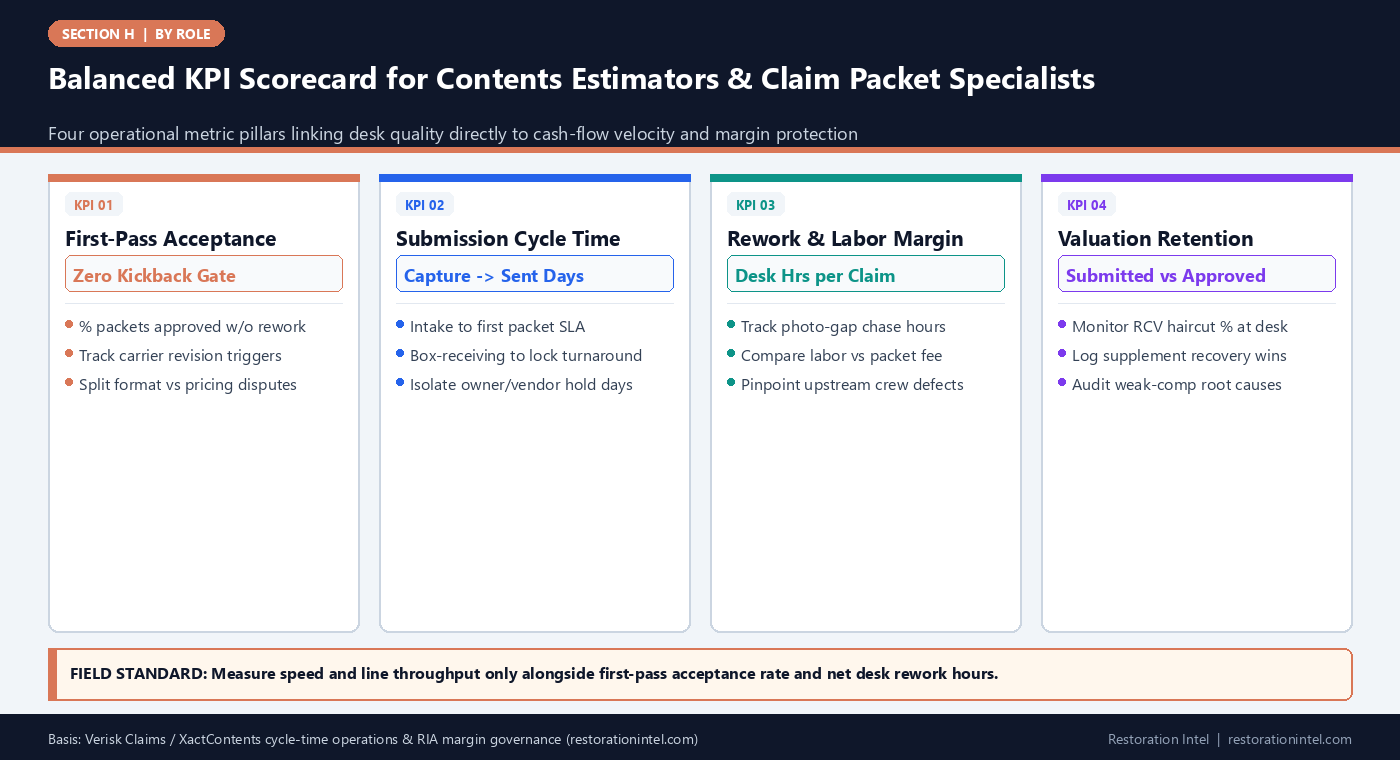
Balanced KPI Scorecard for Contents Estimators & Claim Packet Specialists
Contents Estimator KPI Definitions, Formulas & Operational Diagnostic Signals
Core metrics used by contents divisions to manage desk productivity, packet defensibility, and field-to-desk margin leakage.
| KPI Name | Calculation Formula | What It Actually Measures | Diagnostic Signal When Off-Track | Corrective Operational Lever |
|---|---|---|---|---|
| 1. First-Pass Acceptance Rate | Packets Approved Without Revision / Total Submitted Packets | Clarity of math, photo proof, LKQ comps, and formatting at initial send | Adjusters repeatedly request missing bases, tax fixes, or duplicate scrubs | Tighten H-22 pre-submission QA gate and 5-line random spot-audit |
| 2. Capture-to-Submission Cycle Time | Business Days From Field Capture Lock to Carrier Submission | Estimating throughput velocity excluding external owner/lab hold clocks | Backlog queues pile up after pack-out while vault storage clock ticks | Enforce H-18 concurrent daily photo ingest instead of post-pack-out batching |
| 3. Upstream Rework Ratio | Hours Spent Chasing Field Gaps / Total Desk Estimating Hours | Cost of blurry tags, unlabeled boxes, and missing room boundaries | Estimators spend 30%+ of week emailing crews for retakes and box lists | Retrain field leads on H-17 intake rules and 24-hour recapture punch lists |
| 4. LKQ Valuation Retention % | Approved Claim Line RCV / Submitted Defensible Line RCV | Quality of comparable sourcing and pre-disposal spec proof | Carrier desk examiners routinely substitute lower-tier entry-level comps | Require rating-plate proof and authorized-dealer SKU citations on Tier-1 items |
| 5. Desk Labor Cost per 100 Lines | (Total Estimator Hours x Loaded Hourly Rate) / (Priced Lines / 100) | True unit economics of manual vs standardized enrichment workflows | Small-ticket household schedules consume negative estimating margin | Apply standardized sub-lot grouping for low-value dense storage goods |
| 6. Supplement Recovery Turnaround | Days From Carrier Revision Notice to Resolved Supplemental Approval | Responsiveness and evidence readiness on disputed or pending exceptions | Pending items linger unclosed for months, delaying final job closeout | Maintain explicit Pending queues with weekly owner/adjuster follow-up cadence |
Why First-Pass Acceptance Rate Beats Raw Line-Count Quotas
In contents operations, speed without acceptance is wasted motion. Submitting a 600-line schedule in 48 hours feels productive on Monday, until a carrier desk examiner returns 45 revision notes on Thursday citing missing tax logic, generic ‘box of kitchen’ rows, and unverified electronics prices. Re-opening a file two weeks later costs far more estimator labor than getting it right once.
First-Pass Acceptance Rate measures the percentage of submitted claim packets accepted into settlement or normal negotiation without administrative rejection or foundational documentation kickbacks. Tracking why a packet bounced—separating mechanical QA mistakes from genuine valuation disagreements—tells management whether the desk needs tighter pre-submission checks or stronger LKQ sourcing.
Improving first-pass acceptance directly accelerates cash flow for both the restoration contractor and the policyholder, echoing the estimating cost realities analyzed in The $7,986 Hiding in Your Xactimate.
- Log kickback root causes: Tag every carrier revision request as Math/Format, Missing Photo/Spec, Scope Overlap, or LKQ Comp Dispute.
- Zero-penalty Pending flags: Do not count clean carrier follow-ups on pre-flagged Pending Appraisal items as estimator failures.
- Monthly calibration review: Audit the top three recurring revision triggers across all estimators every 30 days.
Measuring Cycle Time Without Blurring Internal vs. External Holds
Cycle-time averages become useless when they mix internal estimating delays with external bottlenecks outside the estimator’s control. If a file waits 18 days for a homeowner to locate jewelry receipts or for an insurance carrier to approve an OEM technician inspection, charging those 18 days against the estimator’s turnaround SLA creates distorted performance reviews.
Disciplined tracking splits total claim elapsed time into three distinct clocks: Field Capture Window (mobilization to room lock), Internal Desk Cycle Time (capture lock to QA-cleared submission), and External Hold Time (days paused awaiting owner documentation, lab diagnostics, or carrier release). Estimating managers only hold the desk accountable for active internal processing days.
When internal desk cycle time stretches beyond target SLAs despite clean field intake, leaders immediately see capacity bottlenecks and can rebalance high-line-count losses before storage vaults back up.
- Three-clock timestamping: Record Intake Date, Capture-Lock Date, Hold Start/End Dates, and Submission Date on every job.
- Concurrent-ingest benchmark: Measure how quickly daily field uploads are triaged rather than waiting until pack-out completion.
- SLA tiering by job size: Set realistic internal turnaround bands for 150-line water losses versus 1,500-line whole-house fire packs.
Quantifying Upstream Capture Rework and True Estimating Margin
Most contents divisions underestimate how expensive poor field capture is because rework time gets buried inside general estimator payroll. When an estimator spends four hours zooming into blurry basement photos, messaging three technicians to decode ‘Misc Box 42’, and manually deduplicating split-shift uploads, that hidden friction destroys unit profitability on fixed-fee or TPA-capped jobs.
Tracking Upstream Rework Ratio—the share of estimator hours spent resolving missing field evidence rather than enriching clean lines—turns an invisible drag into a visible operational metric. Pairing that ratio with each Pack-Out Crew Lead’s job IDs shows leadership exactly which teams deliver carrier-ready intake and which teams require hands-on coaching.
Comparing loaded desk labor hours against net approved estimating/admin revenue also highlights where line-item granularity needs discipline. Spending 15 minutes researching a $12 plastic wastebasket inside XactContents guarantees negative margin, whereas standardized lot rules protect hours for Tier-1 valuation defense.
- Track rework time codes: Separate normal line enrichment hours from field-gap chase and retake coordination hours.
- Crew quality feedback loop: Share monthly capture-defect scores (missing plates, unlabeled totes) back with field supervisors.
- Tiered effort allocation: Focus deep manual comp research on high-value items while using clean catalog lots for low-dollar commodities.
Auditing Valuation Retention and Building Continuous Desk Calibration
Submitting high initial totals means nothing if 25 percent of the value evaporates at adjuster review due to weak comps or missing specifications. Tracking LKQ Valuation Retention—the ratio of agreed replacement value to submitted defensible value across closed claims—keeps estimators focused on durability rather than wishful pricing.
When retention dips on specific categories such as commercial tools, electronics, or upholstered furniture, the team pulls those disputed lines in a brief peer calibration session. Comparing what comp the estimator submitted against what comp the adjuster approved (and why) quickly sharpens the entire desk’s comparable-selection instincts, reinforcing the practical benchmarks discussed in Which Xactimate Line Items Do Adjusters Actually Approve?.
Combined with transparent tracking of custody-to-valuation parity, this balanced KPI suite ensures the estimating desk protects company margin while earning long-term credibility with every adjuster desk.
- Post-settlement line audit: Review carrier redlines on closed claims to capture real-world comp preferences and tax rules.
- Peer calibration huddles: Walk two anonymized disputed lines per week through the estimating team to align standards.
- Balanced quarterly scorecard: Weight acceptance rate, net cycle time, rework ratio, and valuation retention together—never raw line volume alone.
Practitioner Verification Checklist (H-24)
- Replace raw lines-per-day quotas with a balanced scorecard combining First-Pass Acceptance Rate, Internal Cycle Time, Rework Ratio, and Valuation Retention.
- Log three separate timestamp clocks on every claim (Field Capture, Internal Desk Processing, and External Holds) so turnaround metrics remain fair.
- Track estimator hours spent chasing blurry rating plates or unlabeled boxes by field crew ID to target upstream capture training.
- Categorize every carrier revision request by root cause (Math/Format, Missing Evidence, Scope Overlap, or LKQ Comp) for monthly calibration.
- Review closed-claim adjuster redlines regularly to tighten comparable selection and keep desk labor proportional to item value tiers.
Standards, Authority References & Related Reading
Primary standards, insurance definitions, and sibling Restoration Intel guides referenced in this brief:
- Verisk Property Claims Solutions
- Verisk Xactimate Estimating Platform
- Verisk XactContents Platform Overview
- Restoration Industry Association (RIA)
- Related Guide: Contents Estimator & Claim Packet Specialist: Capture & Documentation Execution Workflow
- Related Guide: Contents Estimator & Claim Packet Specialist: Quality Assurance Review & Pre-Submission Audit
- Related Guide: The $7,986 Hiding in Your Xactimate
- Related Guide: Which Xactimate Line Items Do Adjusters Actually Approve?
- Related Guide: A Pack-Out Record Is Not a Priced Inventory
.md twin for desk QA and team training.Frequently Asked Questions
Why is measuring an estimator solely by lines priced per day counterproductive?
High raw line volume without quality checks encourages blank specifications, duplicate rows, and weak retail comps—generating carrier kickbacks and rework hours that erode division margin.
How should cycle time be measured when a claim stalls waiting for owner receipts?
Separate Internal Desk Cycle Time (from clean field capture lock to packet submission) from External Hold Time (days paused awaiting owner documentation, OEM diagnostics, or carrier release).
What does a high Upstream Rework Ratio tell a restoration manager?
It signals that estimators are spending excessive paid hours chasing missing field photos, unreadable rating plates, or unlabeled containers—pointing directly to intake and field-capture training gaps rather than desk slowness.
What is a healthy approach to tracking LKQ Valuation Retention?
Compare agreed post-review RCV against submitted defensible RCV across closed files, and review recurring adjuster reductions in peer calibration sessions to refine comparable sourcing rules.