Direct Answer: ERP and WMS stock reports alone frequently fail after a warehouse fire or sprinkler discharge because adjusters question whether book balances matched physical racks at loss time; pairing cycle counts with dated visual zone maps proves exact bay occupancy, racking layout, and consignment boundaries.
.md twin for estimator QA and carrier file documentation.
Warehouse and stockroom operators frequently rely on ERP or WMS perpetual inventory reports as their sole pre-loss record. When a localized fire, roof collapse, or sprinkler activation damages three specific pallet aisles while leaving the rest of the building intact, a standalone accounting spreadsheet cannot prove which SKU quantities physically sat inside the wet or burned bays at the time of loss.
Pairing routine cycle-count exports with dated visual zone maps bridges that gap. Numbering every aisle and rack bay, running quarterly aisle-sweep videos synced to cycle-count dates, and separating racking/forklift assets from sellable merchandise aligns physical proof with commercial BPP schedules and ANSI/IICRC S320 custody discipline.
Mapping flammable cabinets, aerosol cages, and lithium-ion battery storage under OSHA HazCom and NFPA Lithium-Ion safety resources also protects first-responding mitigation crews and prevents clean-aisle cross-contamination.
Warehouse Pre-Loss Dual-Control Architecture
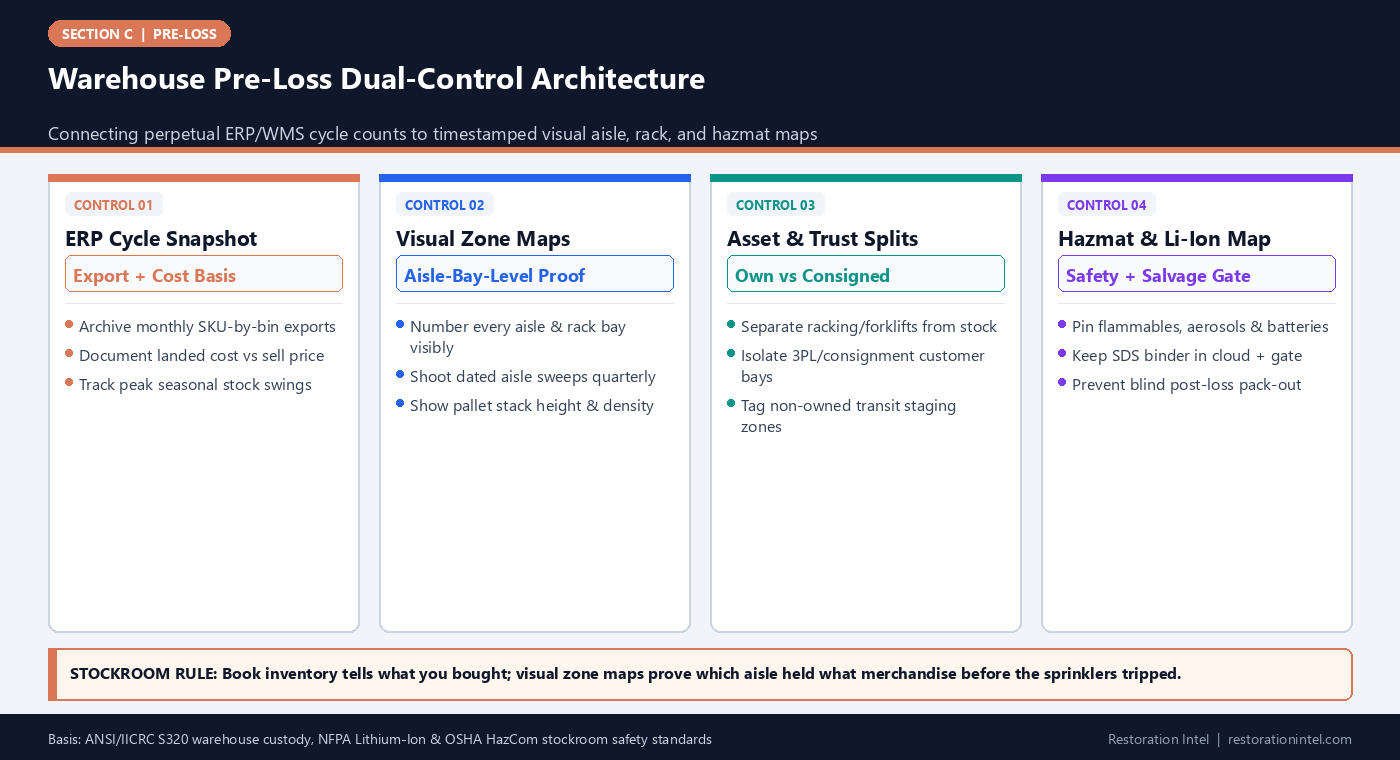
Warehouse & Stockroom Pre-Loss Controls: ERP Data vs. Visual Zone Verification
Dual-layer control framework tying accounting inventory ledgers to physical rack geometry, ownership splits, and hazardous-SKU isolation before a loss.
| Warehouse Control Layer | Book / ERP Evidence | Paired Visual Zone Proof | Common Post-Loss Claim Friction | Pre-Loss Mitigation Action |
|---|---|---|---|---|
| 1. Active Pick Bins & Pallet Racking | Monthly cycle-count CSV by bin ID, SKU, unit cost, and extended valuation | Quarterly aisle-end overview + mid-aisle pallet-height sweep showing bay labels | Water/soot destroys carton labels and adjusters dispute whether high-value SKUs sat in burned bay | Sync quarterly aisle sweep video dates to cycle-count archive snapshots in cloud vault |
| 2. Racking, Forklifts & Material Handling | Fixed-asset register listing steel uprights, wire decks, lifts, chargers, and wrap machines | Equipment fleet lineup photos + forklift/charger serial plates + racking bay spec tag | Commingling permanent racking/equipment with sellable inventory distorts BPP vs stock limits | Keep warehouse equipment on fixed-asset schedule separate from rolling merchandise inventory |
| 3. Consignment, 3PL & Customer Property | Separate sub-ledger or customer-owned inventory report with bailment/storage agreements | Distinct floor striping or high-visibility bay signage marking Customer-Owned / Hold zones | Owned stock and third-party goods blend together after rack collapse or debris haul-off | Map dedicated consignment bays on floor plan and export partner ownership summaries monthly |
| 4. Seasonal Surge & Overflow Trailers | Rolling 12-month inventory valuation curve showing Q4/peak-season balance swings | Overflow staging floor shots + yard/dock trailer inventory tags | Peak-season fire hits during maximum stock levels, triggering severe co-insurance penalties | Share 12-month peak inventory range with licensed broker for peak-season limit review |
| 5. Hazmat, Aerosols & Lithium-Ion Storage | Hazardous SKU flag in WMS + digital Safety Data Sheet (SDS) archive | Flammable cabinet labels, battery-charging bay photos, and sprinkler/containment signage | Untagged chemicals or lithium-ion cells halt emergency stabilization and crew entry post-loss | Post cloud-mirrored SDS index and hazmat bay map inside page-one emergency dossier |
| 6. Damaged / Quarantine / Returns Cage | RMA / damaged-goods write-down ledger distinguishing unsellable pre-loss returns | Clearly gated Returns/Quarantine cage photo so pre-loss defect stock is visible | Adjuster assumes entire warehouse inventory was previously damaged returns or vice versa | Keep returns segregated in a marked cage and run pre-loss write-offs cleanly each month |
Why ERP Inventory Reports Alone Struggle Under Claim Scrutiny
Distributors, e-commerce sellers, and manufacturers often assume their ERP, WMS, or accounting platform gives them automatic pre-loss protection. In practice, a standalone stock ledger exported after a fire or sprinkler event answers only half the claim question: it shows theoretical quantities on the books, not physical placement inside the damaged footprint.
When a single warehouse bay suffers heavy smoke or overhead roof collapse while adjacent aisles remain intact, adjusters and forensic accountants test whether book counts match actual warehouse reality—checking shrink rates, unposted receiving tickets, pre-loss damaged returns, and whether high-margin SKUs were genuinely stored in the affected zone rather than an undamaged wing.
Pairing regular cycle counts with dated visual zone maps closes that evidentiary gap. Just as commercial BPP pre-loss schedules reconcile fixed-asset ledgers against physical rooms, visual bay sweeps tie WMS bin numbers to real pallets and shelves.
- Spot-check proof: Quarterly aisle sweeps demonstrate physical carton density and rack fill levels matching book numbers.
- Partial-loss localization: Visual zone maps establish which SKU families normally occupy wet or burned bays.
- Pre-loss returns clarity: A visibly marked quarantine cage prevents pre-loss RMA goods from tainting sound inventory.
Building the Visual Zone Map and Quarterly Aisle-Sweep Workflow
Creating a visual warehouse baseline does not require shutting down shipping lines. Begin with a simple one-page overhead diagram numbering every aisle, rack run, mezzanine, dock staging lane, and stockroom cage. Ensure large, high-contrast aisle and bay markers are mounted physically so they read clearly in phone video.
Once per quarter—ideally right after scheduled cycle counts—a warehouse supervisor walks each numbered aisle holding a phone at chest height, panning smoothly from floor pallet to top rack beam while briefly reading the aisle ID and primary product group. A 20,000-square-foot stockroom takes less than 25 minutes to capture end to end.
Save the dated video clips alongside that day’s exported ERP cycle-count CSV inside an off-site cloud vault. If a loss hits two months later, restoration estimators following ANSI/IICRC S320 and RIA protocols can pair surviving debris zones immediately against the visual map—accelerating both salvage triage and Day-1 claim reconciliation.
- Overhead bay diagram: Map rack rows, cold rooms, staging lanes, and dock doors on one printable PDF.
- Sync video to CSV date: Capture the visual sweep on the same day a cycle count locks so quantities and imagery match.
- Include stockroom mezzanines: Retail stockrooms and upper mezzanines hold dense boxed inventory frequently overlooked.
Separating Racking, Peak Seasonal Stock, and Third-Party Goods
Warehouses commonly trigger three valuation disputes when everything sits inside one undifferentiated total. First, racking uprights, forklifts, battery chargers, stretch-wrap turntables, and conveyor lines are Business Personal Property equipment, not sellable stock—and they often carry different valuation rules than finished merchandise.
Second, seasonal inventory swings can quietly push total stock value far above policy limits or trigger co-insurance penalties if peak Q4 or pre-season builds are never compared against policy thresholds, as detailed in preventing co-insurance penalties. Tracking a rolling 12-month inventory band gives owners and their licensed insurance brokers clear numbers before peak deliveries arrive.
Third, any goods held on consignment, customer-supplied packaging, or 3PL client pallets must sit in visually segregated bays backed by bailment/storage schedules so third-party property is documented cleanly without distorting owned-stock counts.
- Equipment vs. merchandise split: Keep forklifts, lifts, and bolted racking on a separate asset register from SKUs.
- Rolling 12-month valuation band: Log seasonal troughs and peaks to flag underinsurance windows early.
- Marked consignment bays: Paint or sign dedicated floor zones for non-owned or customer-held merchandise.
Mapping Hazardous SKUs, Aerosols, and Lithium-Ion Storage for Emergency Crews
In a warehouse emergency, what slows restoration crews and inspectors down fastest is unknown chemistry inside unmapped aisles. Pallets of retail lithium-ion power banks, aerosol solvents, pool chemicals, or cleaning concentrates turn routine water extraction into a hazmat hold if responders cannot verify what is stored behind smoke-filled doors.
Integrating OSHA Hazard Communication (HazCom) records and NFPA Lithium-Ion safety guidance directly into the visual zone map solves both safety and salvage speed. Pin flammable cabinets, battery-charging stations, and bulk chemical bays on the facility diagram and mirror the current Safety Data Sheet (SDS) binder in the cloud dossier.
When crews arrive after a sprinkler trip or localized fire, that pre-loss hazmat layer lets them isolate affected chemistry immediately while protecting adjacent clean-merchandise aisles from unnecessary disposal or cross-contamination.
- Pin hazmat zones on the map: Mark flammable lockers, aerosol bays, and lithium-ion pallets clearly on page one.
- Cloud-hosted SDS folder: Keep digital SDS PDFs accessible off-site when physical binders inside the warehouse are wet or burned.
- Protect clean aisles first: Clear zone boundaries allow rapid poly containment around sound inventory adjacent to wet bays.
Practitioner Verification Checklist (C-17)
- Draw a one-page warehouse zone map numbering every aisle, rack bay, mezzanine, dock staging lane, and quarantine cage.
- Export monthly/quarterly ERP or WMS cycle-count CSVs (with unit cost basis) to an off-site cloud vault paired with dated aisle-sweep videos.
- Maintain separate schedules for warehouse equipment (racking, forklifts, chargers), owned sellable stock, and third-party consignment bays.
- Review rolling 12-month peak seasonal stock levels against policy limits with your licensed insurance broker ahead of peak intake.
- Pin all hazmat, aerosol, flammable, and lithium-ion battery storage bays on the zone map and mirror current SDS PDFs in the cloud dossier.
Standards, Authority References & Related Reading
Primary standards, insurance definitions, and sibling Restoration Intel guides referenced in this brief:
- ANSI/IICRC S320 Standard for Professional Contents Restoration
- Restoration Industry Association (RIA)
- NFPA Lithium-Ion Battery Safety Resources
- OSHA Hazard Communication Standard (HazCom)
- Related Guide: Commercial Business Personal Property (BPP) Pre-Loss Schedules: Aligning Fixed Asset Ledgers with Physical Reality
- Related Guide: Preventing Co-Insurance Penalties Through Accurate Pre-Loss Contents Valuation
- Related Guide: Pre-Loss Documentation for Multi-Site Franchises and Chains: Creating a Standardized Store Template
- Related Guide: From Pre-Loss File to Day-1 Claim Schedule: How Estimators Reconcile Surviving vs Damaged Items After a Loss
- Related Guide: Before Anything Goes: The NFIP Contents Inventory
.md twin for desk QA and team training.Frequently Asked Questions
Why isn't an ERP or WMS inventory report enough by itself after a warehouse fire or flood?
ERP reports show theoretical book balances, not physical bay locations or pre-loss returns segregation. Pairing cycle counts with dated visual aisle sweeps proves which SKUs sat in damaged bays and verifies real rack density.
How often should a warehouse update its visual zone map?
Run a full aisle-sweep video quarterly synced to a cycle-count snapshot, and capture quick 5-minute delta updates whenever rack layouts change or seasonal overflow staging opens.
Should warehouse racking and forklifts be listed on the same schedule as sellable inventory?
No. Keep racking, forklifts, battery chargers, and material-handling equipment on a fixed-asset BPP schedule separate from rolling sellable merchandise.
Why put Safety Data Sheets (SDS) and lithium-ion storage locations inside a pre-loss dossier?
Emergency mitigation and contents teams cannot enter smoke- or water-damaged bays safely without knowing where flammables, chemicals, or lithium-ion batteries sit—so pre-mapping them speeds safe containment and protects undamaged aisles.