Direct Answer: Shared file discipline turns claim performance metrics into an objective scorecard across desk examiners, independent adjusters, and public adjusters—tracking first-pass acceptance rate, revision-loop latency, reserve accuracy, cycle time from FNOL to settlement, and administrative rework cost per claim.
.md twin for estimator QA and carrier file documentation.
Every participant across the adjuster interface feels margin and cycle-time pressure, even though each seat measures success differently. A carrier desk examiner is evaluated on reserve accuracy, loss-adjustment-expense (LAE) discipline, and file closure velocity; an independent adjuster firm tracks field-report turnaround, qa-kickback rates, and adjuster hours per claim; and a public adjuster practice or restoration contents division watches gross-to-net recovery, unbilled rework hours, and days to cash.
Without shared operational telemetry, those three scorecards collide. When a desk examiner slashes lines hastily to hit a same-day closure quota, the resulting PA supplement adds thirty days of rework and higher LAE. When an IA rushes field capture to close three extra inspections per day, missing rating plates trigger weeks of back-and-forth verification. And when a restoration or PA team submits unformatted spreadsheets without pre-submission QA, cash flow stalls across the entire pipeline.
As framed in Three Adjusters, Three Economies and The Adjuster Desk: One Standard, Two Chairs, shared file discipline resolves this friction by measuring workflow health neutrally—isolating where time, accuracy, and administrative margin actually leak between field capture and final settlement.
Shared Cycle-Time & Quality KPIs Across the Adjuster Interface
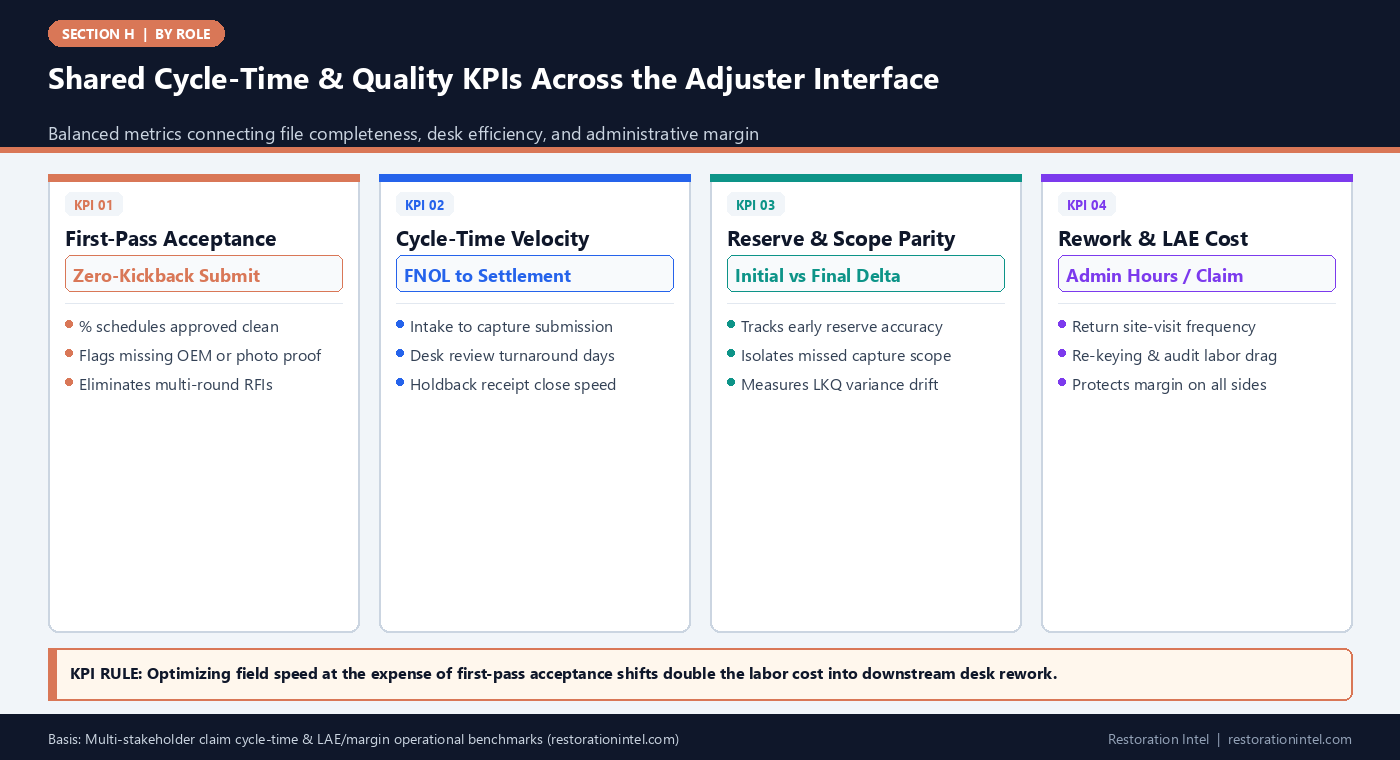
Balanced Performance Metrics Across Desk Examiner, IA, and Public Adjuster Operations
Objective operational KPIs that measure shared file quality, margin protection, and cycle-time reliability without gaming valuation accuracy.
| Operational KPI | Formula / Measurement | Desk Examiner Value | IA & Contractor Value | PA & Policyholder Value |
|---|---|---|---|---|
| First-Pass Acceptance Rate | Schedules Approved Without Structural RFI / Total Submitted | Cuts desk audit touch-time and supervisor escalations | Prevents unpaid QA rework and speeds invoice release | Accelerates initial undisputed ACV delivery to client |
| Field-to-Schedule Turnaround | Business Days From Site Walkthrough to Complete Submission | Stabilizes early reserve setting and storage planning | Reduces WIP bottleneck and warehouse dwell uncertainty | Shortens time to initial proof-of-loss milestone |
| Desk Review Turnaround Time | Business Days From Clean Submission to Written Audit Response | Prevents aging-claim backlog and statutory interest risk | Improves cash-flow predictability and crew scheduling | Allows timely replacement planning before rebuild finishes |
| Supplement & Revision Ratio | Post-Submission Added Value / Initial Submitted Scope | Separates genuine hidden damage from sloppy initial intake | Eliminates unbilled return trips and second-touch labor | Avoids drawn-out multi-month negotiation fatigue |
| Reserve-to-Final Indemnity Variance | |Initial Reserve – Final Paid Indemnity| / Final Paid | Improves carrier loss-ratio forecasting and capital accuracy | Signals whether day-one intake flagged high-dollar exceptions | Reduces sudden late-claim authority freezes at carrier |
| Unbilled Rework Hours per File | Internal Hours Spent Fixing Missing Photos, UOMs, or Duplicates | Lowers loss-adjustment-expense (LAE) friction per file | Protects net operating margin on contents divisions | Preserves staff capacity for substantive valuation disputes |
Why First-Pass Acceptance Rate Governs Both Margin and Cycle Time
Across all three adjuster perspectives, the single strongest leading indicator of claim velocity and administrative margin is First-Pass Acceptance Rate—the percentage of submitted contents schedules, supplement packets, or IA verification reports accepted into valuation review without being kicked back for missing photos, broken taxonomy, duplicate entries, or unverified specs.
When a packet passes on first submission, a carrier desk examiner finishes review in a single contiguous session instead of reopening the file three times over six weeks. That single-touch efficiency lowers carrier Loss Adjustment Expense (LAE), eliminates unbilled estimator rework for restoration firms and PAs, and puts undisputed ACV funds into the policyholder’s hands weeks earlier.
Conversely, chasing raw ‘submission speed’ by pushing incomplete field logs out the door creates an illusion of productivity: hours saved on day two turn into days lost to RFIs, return warehouse pulls, and strained adjuster relationships on day twenty.
- Track kickback root causes: Categorize every desk RFI by exact failure type (missing model plate, vague lot, duplicate row, tax/UOM error, or disputed LKQ).
- Separate formatting RFIs from policy disputes: Distinguish objective documentation gaps from legitimate valuation or coverage disagreements.
- Reward clean submissions: Measure team productivity on ‘approved first-pass files’ rather than raw draft count.
Separating Capture Variance From Valuation Variance in KPI Reviews
A classic mistake in claims analytics is measuring only final settlement delta—comparing an initial submitted RCV against final paid RCV—without separating why the numbers differed. A 15 percent variance caused by discovering an overlooked storage shed during demolition is a capture-intake gap; a 15 percent variance caused by substituting entry-level comps for documented custom furniture is an LKQ valuation dispute.
As demonstrated in Which Xactimate Line Items Adjusters Approve and A Pack-Out Record Is Not a Priced Inventory, splitting physical completeness metrics from catalog pricing metrics keeps leadership from prescribing the wrong fix. IA managers, PA principals, and carrier QA leads can coach field teams on closet sweeps while calibrating estimating desks on retail sourcing rules independently.
Using standard estimating audit logs inside Verisk claims platforms and Symbility gives organizations clear visibility into where line edits concentrate.
- Two-bucket variance logging: Record physical quantity/omission changes separately from unit-price and depreciation adjustments.
- Track reserve accuracy at day 10: Measure how closely day-one intake flags predict final contents exposure before all receipts settle.
- Monitor holdback completion lag: Track how long recoverable depreciation stays open past structure completion so insureds do not miss deadlines.
Quantifying Rework Drag, Storage Dwell, and Administrative Friction
Margin erosion in contents operations rarely shows up on a single line item; it hides in unbilled administrative hours and stalled warehouse capacity. Every time an estimator spends four hours hunting down missing model numbers, or a warehouse crew pulls sealed vault crates twice to photograph an item omitted at intake, net division margin drops.
On the carrier side, slow desk turnaround on pack-out authorizations and non-salvageable holds drives avoidable vault storage days and emergency hotel/ALE extensions—raising total claim severity without buying a single additional item for the insured. Public adjusters experience the same drag when sloppy initial documentation forces repeated re-inspections that consume staff capacity across their active caseload.
Tracking ‘administrative rework hours per claim’ and ‘authorization wait days’ exposes the hidden cost of poor file discipline across all three seats, making the business case for upfront QA undeniable.
- Measure storage dwell days: Track days elapsed between pack-out intake and written clean-vs-total-loss disposition approval.
- Log second-touch warehouse pulls: Count how often crates are reopened post-intake due to missing photos or serial tags.
- Audit cycle-time bottlenecks by stage: Separate intake-to-submit lag, desk-review lag, and post-audit reconciliation lag.
Using Shared File Discipline to Align Incentives Without Compromising Independence
Carrier desk examiners, independent adjusters, and policyholder-side public adjusters serve distinct contractual roles, and healthy tension over policy coverage or valuation will always exist on complex claims. Shared file discipline does not ask any participant to surrender their fiduciary duty or analytical rigor.
What it establishes is an objective operational floor: clean room IDs, locked field timestamps, 1:1 photo linkage, transparent LKQ anchors, and pre-submission QA checks. When all three parties measure cycle-time stages and first-pass acceptance against that shared file standard, claims spend less time trapped in clerical ping-pong and more time reaching fair, documented closure.
For restoration leaders, IA supervisors, and PA firm principals alike, tracking these balanced KPIs quarterly reveals exactly which intake, capture, or handoff habits deliver faster resolutions and healthier operational margins.
- Quarterly KPI post-mortems: Review the top five recurring RFI triggers across closed claims and update intake/QA checklists accordingly.
- Balance speed with completeness: Pair turnaround SLAs with strict first-pass accuracy gates so crews never sacrifice proof for raw clock speed.
- Benchmark by peril complexity: Compare cycle-time KPIs within matching loss tiers (Cat 1 water vs structure fire vs CAT surge) for fair team coaching.
Practitioner Verification Checklist (H-32)
- Track First-Pass Acceptance Rate and classify every desk RFI by exact root cause (spec gap, duplicate, scope overlap, or LKQ dispute).
- Separate physical capture variance (missed rooms or counts) from valuation variance (LKQ comp or depreciation adjustments) in monthly KPI reviews.
- Measure business-day cycle time across distinct handoff stages: Intake-to-Submission, Desk Review Turnaround, and Holdback Close.
- Log unbilled rework hours, warehouse re-pull counts, and disposition wait days to quantify the true cost of incomplete field handoffs.
- Benchmark team performance within comparable peril tiers so cycle-time targets never incentivize rushed, under-documented capture.
Standards, Authority References & Related Reading
Primary standards, insurance definitions, and sibling Restoration Intel guides referenced in this brief:
- ANSI/IICRC S320 Standard for Professional Contents Restoration
- Restoration Industry Association (RIA)
- Verisk Property Claims Solutions
- Symbility Claims Support Portal
- Related Guide: Adjuster Interface (Desk Examiner, IA & Public Adjuster): Team Handoff Between Field Capture and Desk Estimating
- Related Guide: Adjuster Interface (Desk Examiner, IA & Public Adjuster): Quality Assurance Review & Pre-Submission Audit
- Related Guide: Three Adjusters, Three Economies
- Related Guide: The Adjuster Desk: One Standard, Two Chairs
- Related Guide: Which Xactimate Line Items Do Adjusters Actually Approve?
.md twin for desk QA and team training.Frequently Asked Questions
What is a healthy First-Pass Acceptance Rate for contents schedules?
While complex fire or commercial claims naturally trigger targeted questions on high-dollar exceptions, disciplined teams target 85 to 95 percent line-level acceptance without structural, math, or missing-photo kickbacks.
Why should carriers and contractors track storage dwell days as a shared KPI?
Slow desk sign-off on clean-versus-total-loss dispositions leaves contents sitting in climate-controlled vaults unnecessarily, inflating carrier LAE/ALE costs while tying up contractor warehouse capacity.
Does measuring cycle time encourage adjusters or estimators to cut corners?
Only if tracked in isolation. Pairing cycle-time velocity with First-Pass Acceptance Rate and post-audit variance metrics ensures speed comes from clean upfront documentation rather than rushed shortcuts.
How do public adjusters benefit from tracking internal rework hours per claim?
Every hour spent chasing missing photos or reconciling mismatched line numbers is capacity taken away from high-value valuation advocacy and client service; reducing clerical rework directly improves firm throughput and client satisfaction.