Direct Answer: Flat-line depreciation divides chronological age by expected useful life at a constant annual percentage, which routinely misprices both rapid year-one market drops on electronics and appliances and documented maintenance rebuilds that reset an asset's effective age on high-value furnishings, machinery, and specialty equipment.
.md twin for estimator QA and carrier file documentation.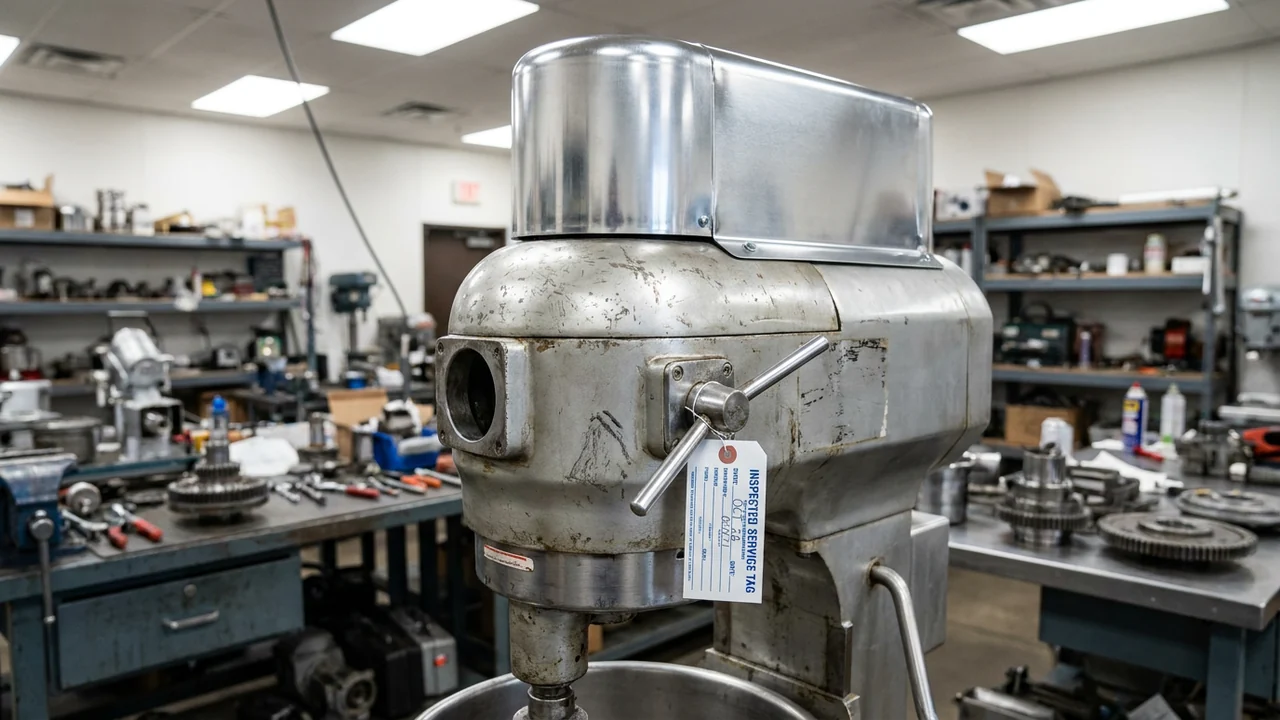
Most automated estimating workflows apply straight-line depreciation by default: take the item’s chronological age, divide by a generic useful-life table value, and deduct that flat percentage from Replacement Cost Value (RCV) until hitting a preset salvage floor. That arithmetic is fast on a 600-line residential pack-out, which explains why carriers and high-volume estimating desks rely on it for baseline schedules inside Verisk XactContents.
The trouble starts whenever real-world asset value does not decay in a straight line. A three-year-old television or mid-range laptop loses a steep share of its market value in its first twelve months and then flattens out, whereas a twelve-year-old commercial sewing machine or heirloom leather sofa that was professionally rebuilt two years before the loss behaves far younger than its purchase date. Understanding how non-linear curves and effective-age resets align with IRMI depreciation principles keeps contents claims anchored to physical reality rather than rigid spreadsheet math.
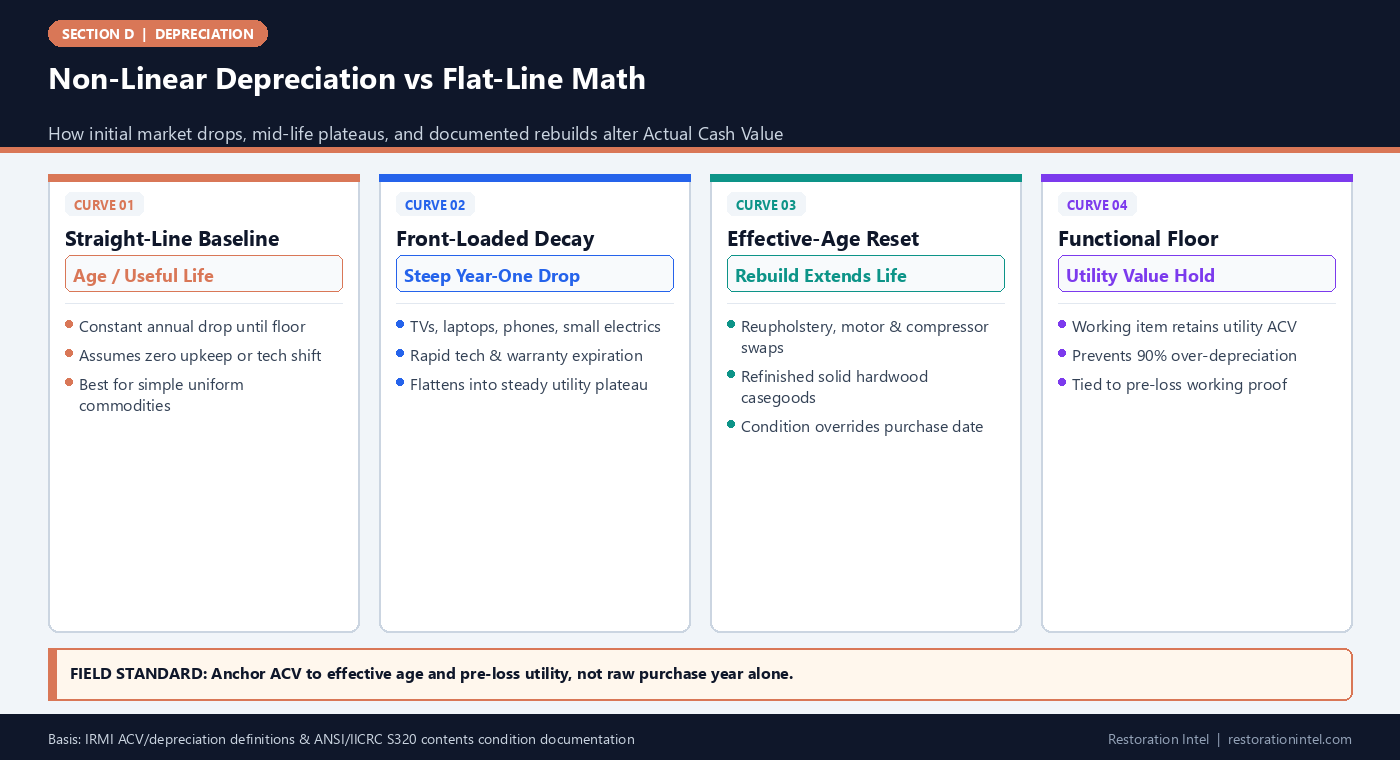
Non-Linear Depreciation vs Flat-Line Math
Depreciation Curve Profiles Across Common Contents Categories
Comparing where flat-line tables diverge from market and physical condition reality across four recurring asset classes.
| Asset Category | Flat-Line Assumption | Actual Value Curve | Key Reset or Distortion Trigger | Defensible Documentation |
|---|---|---|---|---|
| Consumer Electronics & TVs | Even 15-20% annual drop over 5-7 years | Steep 30-45% year-one drop, then slower plateau | Annual model refresh and smart-OS support cutoffs | Model-year release date, firmware status, live LKQ comp |
| Upholstered Seating (High-End) | 10% annual drop over 10-year table life | Slower frame decay; fabric/foam step-down | Full reupholstery or cushion-core rebuild resets wear | Upholsterer invoice, stitch/frame photos, fabric spec |
| Major Kitchen Appliances | Linear 7-10% per year over 10-15 years | Early warranty drop, steady mid-life utility | Sealed-system compressor or control-board replacement | Service work order, parts receipt, rating-plate serial |
| Power Tools & Shop Machinery | Flat 10% per year across 10 years | Low initial drop for pro-grade tools; wear-driven | Bearing, motor brush, chuck, or belt overhaul | Maintenance log, intact housings, pre-loss test notes |
| Apparel & Everyday Footwear | Uniform 20% annual table deduction | Sharp immediate drop once worn; fast wash wear | Seasonal deadstock or unworn tagged closet stock | Tags-on photos, dry-cleaner receipts, closet density shots |
Why Flat-Line Depreciation Fails in Both Directions
Straight-line depreciation treats value loss as a uniform march toward zero. On an item with a ten-year assigned useful life, flat-line math deducts 10 percent after year one, 50 percent after year five, and 80 percent after year eight. While easy to audit in a high-volume desk review, that constant slope ignores how secondary markets and functional utility actually behave in households and commercial spaces.
In the first direction, flat-line schedules under-depreciate fast-obsolescing goods in year one. A 14-month-old smartphone or entry-level printer rarely commands 80 percent of its new retail price on the open market once its factory warranty expires and a newer generation ships. In the opposite direction, flat-line tables punish durable goods in years six through twelve: a solid maple dining set or cast-iron stand mixer in active daily service still delivers near-full functional utility, yet flat math can strip 70 to 80 percent of its value purely because of the calendar.
- Obsolescence vs physical wear: Technology items lose value through specification lag before physical components fail, creating a concave early curve.
- Utility plateau effect: Functional appliances and solid furniture maintain stable use value across years four through ten when routinely serviced.
- Salvage floor distortion: Uncapped linear formulas drive working items toward near-zero ACV unless an explicit working-condition floor is enforced.
How Maintenance Rebuilds Reset Effective Age
Under standard Actual Cash Value (ACV) doctrine, depreciation reflects physical wear and tear, age, and obsolescence at the moment immediately preceding the loss. When an owner invests in a substantive rebuild or component replacement, the asset’s chronological purchase date stops being a reliable proxy for remaining useful life. Replacing a sofa’s spring suspension, webbing, foam cores, and top-grain upholstery leaves only a seasoned kiln-dried frame—often stronger than modern budget builds.
The same effective-age principle governs rebuilt commercial espresso machines, re-cored shop compressors, refinished hardwood casegoods, and reconditioned musical instruments. Desk examiners routinely allow lower depreciation percentages when the file distinguishes cosmetic cleaning from structural restoration and attaches dated third-party invoices showing what components were renewed.
- Component-weighted age: Calculate depreciation against the age of the wearable assembly (motor, upholstery, electronics board) rather than the outer chassis alone.
- Invoice specificity: Paid shop tickets listing parts replaced, labor hours, and serial numbers carry far more weight than homeowner verbal recollections.
- Pre-loss photo corroboration: Close-up frames showing unfrayed welting, clear finish coats, and clean mechanical housings confirm the rebuild held up until the loss.
Documenting Year-One Drops and Mid-Life Plateaus Fairly
Practitioners on both sides of the claim desk lose credibility when they cherry-pick curve shapes—arguing for non-linear grace on rebuilt furniture while demanding flat-line protection on three-year-old consumer electronics. A disciplined contents workflow applies curve logic consistently by asset class and documents the exact condition evidence collected under ANSI/IICRC S320 field protocols.
When a claim is governed by Replacement Cost Value (RCV) with recoverable holdback, steep non-linear depreciation on ACV still matters enormously to cash flow because the initial ACV check funds immediate replacements. Explaining the difference between chronological age and effective age in the line-item notes keeps initial holdbacks realistic so insureds are not starved of working capital.
- Explicit condition grading: Pair every adjusted depreciation line with an objective grade (Mint, Good, Fair, Poor) tied to visible evidence.
- Market-comp triangulation: Where rapid obsolescence applies, support the curve with verified secondary-market or generation-successor specs rather than guesswork.
- Transparent formula notes: State both chronological age and assigned effective age in the estimator note so the desk examiner sees the exact adjustment math.
Handling Depreciation Floors on Working Pre-Loss Assets
One of the sharpest friction points on multi-year inventories occurs when an item’s chronological age exceeds the estimating software’s default life expectancy—such as a 16-year-old Sub-Zero refrigerator or a 20-year-old solid oak roll-top desk. Strict linear math produces 100 percent depreciation, implying the item had zero value minutes before the fire or flood.
In practice, courts, appraisal panels, and carrier guidelines recognize that a functioning item in active household or commercial use cannot have a zero ACV unless it was non-operational junk prior to the loss. Applying a documented maximum depreciation cap (commonly holding working assets in good condition at a meaningful residual utility percentage, subject to carrier policy rules) bridges the gap between aging table math and real replacement fairness.
- Pre-loss operability proof: Document plugged-in status, food/contents inside refrigerators, or active workspace setup at the scene.
- Distinguish scrap from service: Separate items stored broken in a basement corner from actively used fixtures before requesting a cap.
- Respect policy caps: Verify whether state fair-claims rules or specific policy language restrict minimum ACV floors.
Practitioner Verification Checklist (D-14)
- Record both chronological purchase year and observed physical condition grade on every high-value line item.
- Collect dated rebuild, reupholstery, or mechanical repair invoices before calculating effective age on older assets.
- Separate fast-obsolescing electronics from durable hardwood, cast-metal, or mechanical assets instead of applying one flat curve.
- Flag items older than standard useful-life tables that were actively operating pre-loss and document operability evidence.
- Explain every non-standard depreciation percentage in a concise line note citing effective age and supporting photo IDs.
Standards, Authority References & Related Reading
Primary standards, insurance definitions, and sibling Restoration Intel guides referenced in this brief:
- IRMI Insurance Glossary: Depreciation
- IRMI Insurance Glossary: Actual Cash Value (ACV)
- Verisk XactContents Platform Overview
- ANSI/IICRC S320 Standard for Professional Contents Restoration
- Related Guide: How Useful-Life Depreciation Tables Work — and Where Adjusters and Contractors Misapply Them
- Related Guide: Condition vs Chronological Age: Documenting Pre-Loss Care to Defend Lower Depreciation Percentages
- Related Guide: Electronics and Rapid-Obsolescence Depreciation: Handling Computers, TVs, and Smart Devices Fairly
- Related Guide: Furniture Valuation and Depreciation: Solid Wood vs Veneer, Upholstery Grade, and Custom Joinery
- Related Guide: The Adjuster Desk: One Standard, Two Chairs
.md twin for desk QA and team training.Frequently Asked Questions
What is the difference between chronological age and effective age in contents claims?
Chronological age is simply the calendar time since manufacture or original purchase. Effective age reflects an item’s actual physical condition and remaining useful life after accounting for maintenance, component rebuilds, or light use.
Can an actively used appliance ever be depreciated to 100 percent?
Generally no, if it was functioning prior to the loss. Most carrier guidelines and estimating platforms apply a maximum depreciation cap or salvage floor—often leaving a residual utility value—unless the item was already broken or discarded before the event.
Why do electronics drop faster in year one than furniture?
Electronics face immediate technological obsolescence, warranty expiration, and rapid annual product cycles, creating a front-loaded market curve, whereas quality furniture primarily experiences gradual physical wear.
What proof convinces a desk examiner to lower depreciation on a rebuilt item?
Paid repair or reupholstery invoices detailing replaced components, combined with dated pre-loss or clean-area inspection photos showing intact finishes, tight joints, and clean mechanical parts.