Published November 14, 2026. By Will Tygart · Restoration Intel Editorial Desk.
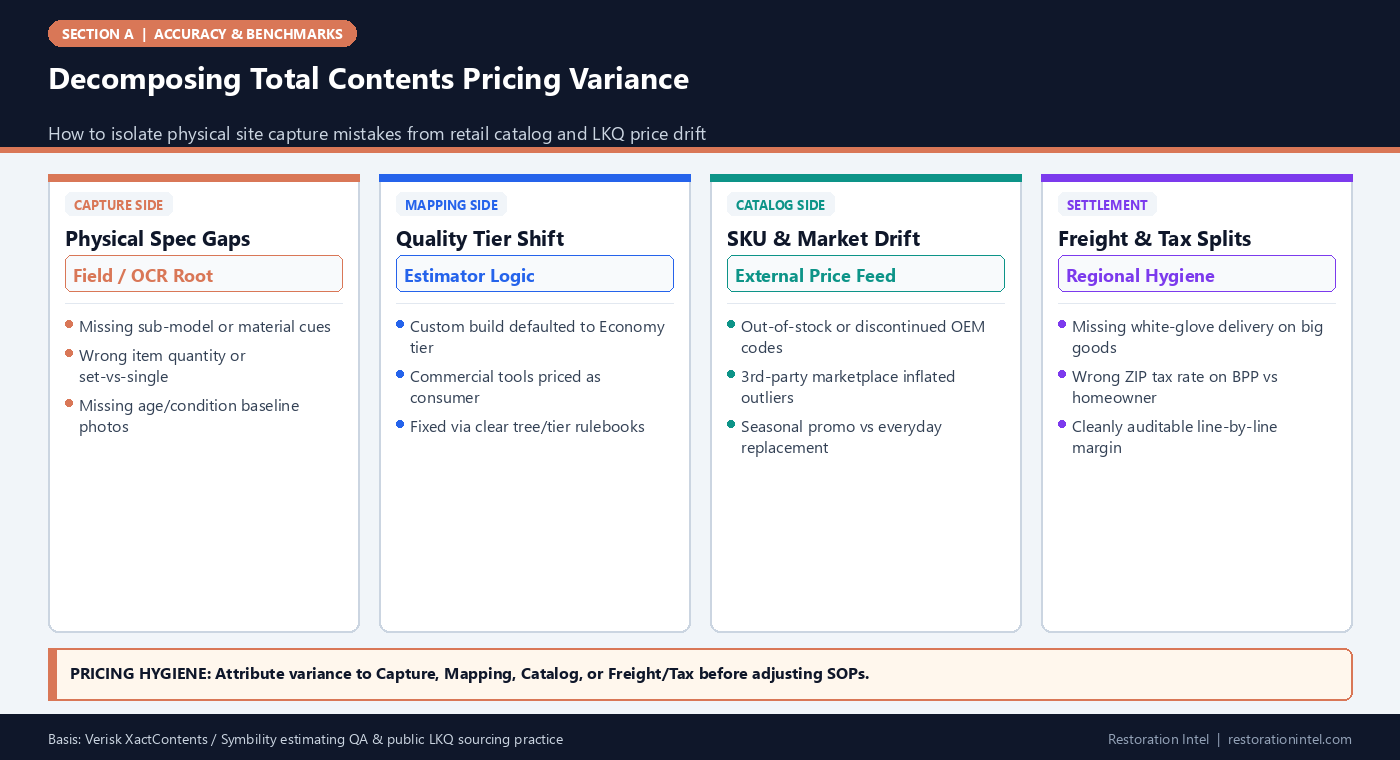
Direct answer. Total pricing variance on a contents claim is the sum of physical capture misses, catalog SKU drift, regional tax/freight mismatches, and Quality-Tier translation errors — and mixing these four sources makes estimating teams fix the wrong workflow.

Suppose a desk examiner cuts $3,800 from a $28,000 residential contents schedule. Inside most restoration offices, that $3,800 haircut gets blamed broadly on ‘bad inventory’ or ‘stingy adjusters’. Neither diagnosis helps management eliminate the gap on next week’s files.
In reality, pricing deltas come from two completely different pipelines. Capture variance occurs when field documentation misstates what the item is — calling a solid maple dresser laminate, missing an appliance sub-model, or counting 6 chairs instead of 8. Catalog drift occurs even with perfect field evidence when replacement pricing pulls discontinued retail listings, third-party marketplace scalper prices, omitted freight charges, or mismatched sales tax tables.
Four Variance Buckets & Diagnostic Audit Signatures
| Variance Source | Root Cause | Typical Carrier Red Flag | Department Owner | Diagnostic Verification Check |
|---|---|---|---|---|
| 1. Physical Identity Error | Wrong brand, missing capacity, obscured model tag, wrong count | ‘No proof of Pro-Series model; priced standard unit’ | Field Crew | Check raw site photo — does visual proof actually support submitted description? |
| 2. Quality Tier Translation | Generic description pushed into wrong price-list preset | ‘Upgraded custom pricing without material documentation’ | Contents Estimator | Compare material/brand cues in photo against selected Economy/Avg/High/Custom tier |
| 3. Catalog / Marketplace Drift | Phantom third-party reseller links or discontinued SKU inflation | ‘Item available from authorized dealer at 40% lower RCV’ | Pricing Database / QA | Cross-check LKQ match across two authorized mainstream retailers |
| 4. Tax, Freight & Setup Gap | Missing regional sales tax or LTL delivery/installation fees | ‘Shipping disallowed without bulky freight documentation’ | Estimator / Billing | Verify loss ZIP tax table and manufacturer shipping terms on large goods |
Why Third-Party Marketplace Prices Trigger Instant Carrier Pushback
Live web scraping and automated retail pricing lookups solve catalog staleness, yet introduce a subtle failure mode: phantom marketplace listings. When a five-year-old coffee maker or discontinued ceiling fan disappears from major retail shelves, algorithmic pricing lookups occasionally surface third-party reseller listings priced at 2x to 4x original MSRP because only one remaining unit sits on an obscure storefront.
Filing those outliers as Like-Kind-and-Quality replacements destroys estimator credibility with carrier desk examiners. As discussed in our LKQ matching mechanics guide, defensible pricing pipelines reject unverified third-party spikes and default cleanly to current-generation functional equivalents from reputable merchants.
- MSRP sanity guard: Any replacement price exceeding 1.5x typical class range requires secondary dealer verification and screenshot archive.
- Promo vs baseline rule: Document non-clearance retail pricing rather than transient 48-hour flash sales that insureds cannot reliably reproduce.
Reconciling Static Estimating Databases Against Live Retail Comps
Static regional price lists inside property estimating platforms provide predictable standardization for everyday commodities (socks, kitchen bowls, bath towels). Yet static lists lag fast-moving categories like consumer electronics, custom cabinetry accessories, and specialty sporting goods.
Smart QA workflows split schedules intentionally: use carrier-accepted estimating catalog averages for sub-$100 commodities where speed rules, and attach live authorized-retailer LKQ citations with date-stamped links/screenshots on major assets above $250 or specialty tools. When freight and regional delivery minimums apply — such as lift-gate pallet delivery for heavy commercial refrigeration or LTL white-glove crating for oversized furniture — itemize those delivery rules transparently rather than inflating base unit price silently.
- Lock regional ZIP sales tax settings cleanly inside estimating templates prior to running batch exports across commercial vs homeowner loss files.
- Archive retailer PDF printouts or PNG price confirmations at the moment of capture because online seasonal links frequently return 404 errors before claim settlement closes.
Tracking Variance Root Cause on Closed Supplements
Whenever a carrier returns a contents schedule with pricing adjustments, tag every disputed line internally with one of the four variance codes (Capture, Tier, Catalog, Freight/Tax). Within 30 days, patterns emerge unmistakably: either field crews are skipping wood/fabric detail photos, or estimators are letting stale catalog URLs slip into final packets. Sharing that monthly root-cause breakdown between estimating desks and pack-out crew leads stops repetitive pricing haircuts before they compound across large commercial losses.
Field Execution Checklist
- Tag every post-submission carrier adjustment internally as Capture Error, Quality Tier Shift, Catalog Drift, or Tax/Freight.
- Filter out inflated third-party reseller outliers on discontinued SKUs; price current functional LKQ equivalents instead.
- Attach verified authorized-retailer screenshots/URLs for any replacement line above $250 RCV.
- Verify loss-site ZIP sales tax rate and delivery/white-glove freight inclusions before exporting final schedules.
- Maintain consistent Estimating vs Claim Custody separation as emphasized in pricing-vs-custody operational reviews.
Related Restoration Intel Guides & Reference Standards
- Companion Brief (A-01): How Restoration Teams Should Define and Measure Contents Inventory Accuracy
- Companion Brief (F-09): Automated Pricing Lookup & LKQ Matching: Static Price Lists vs Live Retail Catalog Retrieval
- Companion Brief (A-08): First-Pass Adjuster Acceptance Rate: Defining the Industry Metric That Actually Drives Cash Flow
- Internal Guide: A Price Tag on a Lost Item Is Worth Nothing
- Internal Guide: Xactimate vs. Symbility
- Primary Authority: Verisk XactContents Platform Overview
- Primary Authority: Verisk Property Claims Solutions
- Primary Authority: Symbility Claims Support Portal
- Primary Authority: Restoration Industry Association (RIA)
Frequently Asked Questions
Why do two estimators get different RCV totals from the exact same loss photos?
Usually because one relies on default mid-tier catalog entries while the other identifies specific brand tiers or sources current-generation LKQ retail comps with freight and tax included.
Are static price lists or live retail scrapes better for carrier acceptance?
A hybrid wins: static carrier price-list averages work cleanly for everyday low-cost household items, while live verified LKQ dealer quotes protect accuracy on appliances, electronics, and specialty goods.
What makes a retail price comp defensible to a desk examiner?
Current in-stock availability from a recognized manufacturer or mainstream retailer matching key functional specs (capacity, material, wattage, tier) with clear capture date.
Does sales tax apply equally across all contents lines?
Sales tax rules follow loss state/county statutes and policy RCV/ACV terms; verify regional tax flags in the estimating profile before exporting.
.md twin (pricing-variance-contents-schedules-capture-vs-catalog-drift.md).